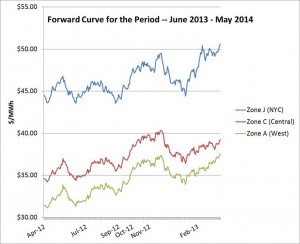
There’s good news and bad news as you contemplate your next 12 months of electricity costs. The bad news first. Compared to a year ago, and to January 2013, markets are up. Look at the graph to the left. This graph shows how the same wholesale strip of power costs, for the same 12 month period (June 2013-May 2014) has moved between last April and today. We are showing you the on-peak price for three major traded zones in NY State– Zone J, NY City, Zone C, the Central Region, and Zone A, the Western region of NY. This information shows that markets are up between 8 and 15%.

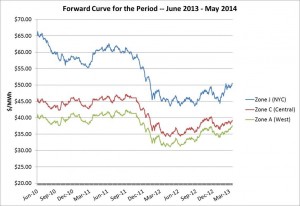
Don’t despair. Despite how that last curve looks to you, your business is still benefiting from relatively low forward market prices. When you view how this curve has moved over the past 3 years, for the same time frame and the same Zones, you can see that markets remain relatively low compared to historical prices.
Bottomline for businesses: Expect your forecasted budgets to be higher this year as you consider signing an electricity contract. Review a forecast of costs for all product types (fixed price, index and block and index) when you go out to buy, but remember that we continue to enjoy relatively low electricity prices– particularly compared to longer term historical prices.
