As we have reported here, capacity prices in New York state are undergoing some market and regulatory changes. We thought it was time for an update on these changes, as they will impact budget forecasting and 2014 costs. In fact, there are two distinct issues related to capacity, particularly in New York City, that are in play these days. We cover both of these two issues in this post.
1) NY City Capacity Price Run Up.
In the last few months, NYC capacity prices for the winter strip and monthly auctions have increased substantially.
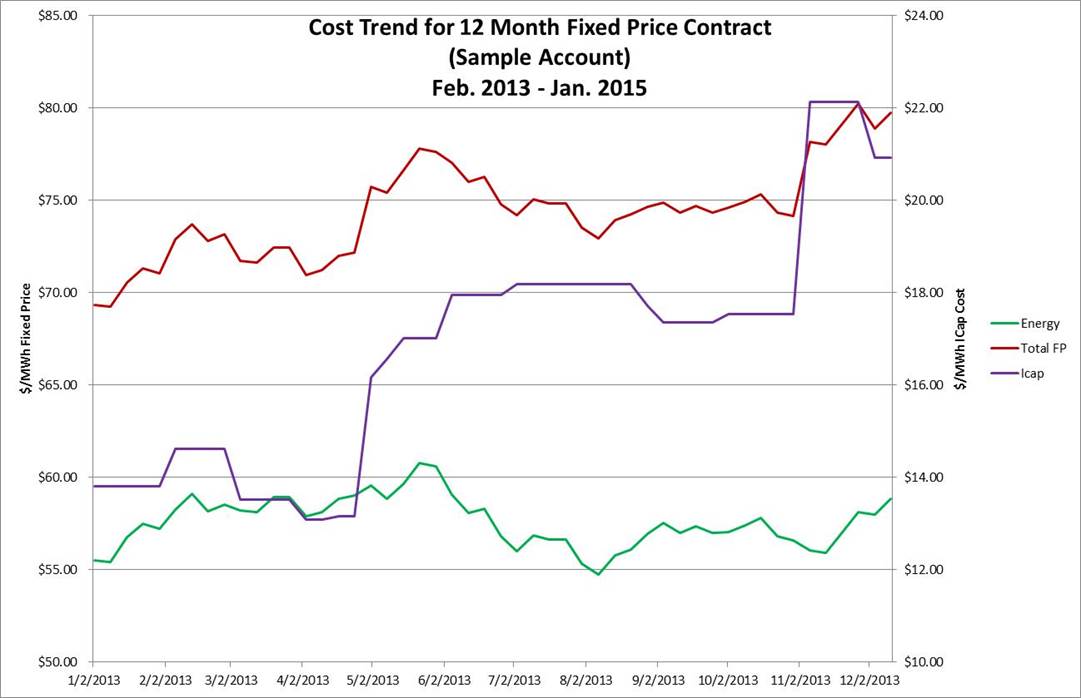
The following graph uses data from a sample account in NY City– and shows the relative contribution of power and capacity costs to the overall fixed price. As you can see from the following graph, capacity costs have increased from $13/MWh to $21/MWh (from 17% of costs to almost 27% of total costs) between April and December 2013.
2) New Capacity Load Zone
For more details about the regulatory rationale for a new capacity load zone, and the gory market details, take a look at the NY Independent System Operator website (here is an ISO sponsored report and presentation on the subject) as well as FERC filings.
It is likely that implementation of the new capacity zone will take place over three years. Based on that assumption, we have calculated an estimate of the cost impact owing to these capacity market changes.
NYISO projections — cost of ICap in the New Capacity Zone (Load zones G-J)

Here, we are using NYISO projections on cost of ICap in the new capacity zone (load zones G-J) as filed at FERC. (The reference point is to Auction clearing prices for Summer 2013 and Winter 2013-2014. We assume that the new load zone will be phased in over three “capacity” years.)
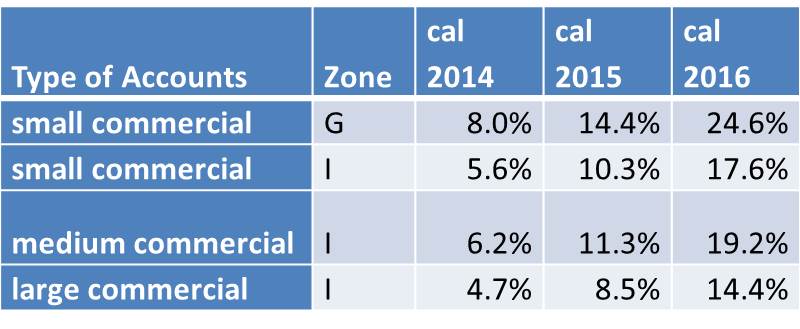
To give you an idea of the effect of these changes in capacity prices on the overall cost of electricity, we analyzed a sample of accounts in our database. Below, we show the changes in a full requirements fixed price for each of the next three calendar years. These fixed price estimates are based on the forward market for energy and our best estimate of future costs (such as ancillary services, etc). Each of the sample accounts have different mixes of load profiles and load factor. Here we define load factor as the relationship between annual energy and the current ICap obligation (the “ICap Tag”). The percentage changes are relative to a full requirements rate using 100% rest-of-state ICap costs as if the new zone did not exist.
You can be sure that your own costs will not exactly follow these forecasts– because each utility account will have different capacity and usage characteristics. But it does give you a sense for the cost impacts that you can expect.
Bottomline for businesses: As you would expect, any uncertainty about market rules or future pricing can create challenges for suppliers and consumers. This uncertainty can create an opportunity for suppliers to shift risk back to you, the buyer. It is imperative that you make sure that you have transparency into how your supplier will manage this cost risk.
Suppliers will be pricing in risk premiums to offset the uncertainty in the capacity markets. Some suppliers will pass all price increases on to customers starting in May, others may pass through either reductions or increases, still others may honor the price you pay now and not pass through any changes. Will your supplier pass through any additional costs that result from these changes? If so, will you be able to see, track and verify any cost changes easily? What happens if your actual costs are lower than forecast by your supplier? Will you benefit? Make sure you read the fine print in your contract. And let us know if you have questions.


