What do forward markets look like now?
Given the high cost of forward and day ahead power prices for the Winter months, it can be difficult to make sense of markets—where are we and where are we going with energy markets?
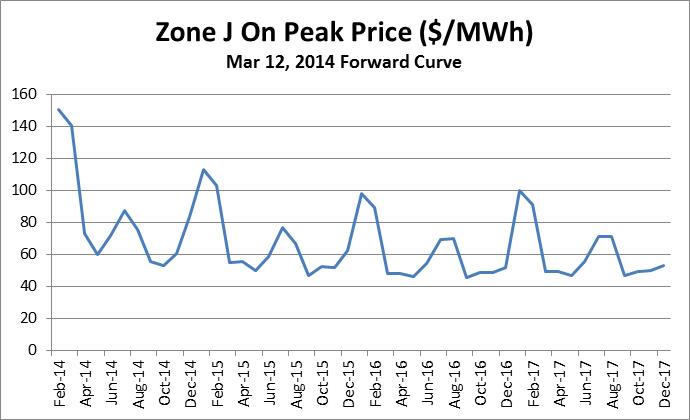
Here’s a look at recent forward curves which shows on-peak power prices in New York City for next month through December 2017. Notice that the curve is what traders call “backwardated”. Backwardation happens when prices that are available in the next few months are higher than the prices you will see in latter months or even in the spot market. In current market conditions, both cases are true– the forward curve for the next few months is higher than latter months. What you would expect to pay for the next few months is about as high as recent spot market prices— limiting your options as a buyer. As you can see from the following graphic, forward curves have a downward slope.
The Challenge This Pattern Represents
The challenge for buyers of power is that you are most concerned about your budgets for the next 12 months, not the 24 months that follow. There are strategies that you can employ today to help you in the future. You can analyze the best way to meet budgets down the road, while navigating short term power markets. To do that, though, you must have access to data and market forecasts… which are literally changing every day. This information is essential for energy buyers. You can’t navigate these markets without dynamic, customized forecasts.
Bottom line for Businesses: You can not navigate today’s energy markets without clear, transparent, customer-specific information. Call us. We can help.

