Here’s an update on day ahead clearing prices for New York State through May 2014, and a graphic that shows the capacity auction clearing prices for the summer strip. Let’s just say we’re living in interesting times.
Day Ahead Clearing Prices
The NYISO has published their latest market statistics in their May Monthly Report. Day ahead clearing prices in May were down compared to a year ago and compared to April 2014. That’s good news… perhaps a bit of a return to normalcy in these markets. Here’s the significant news, though, as reported by the NYISO in their May summary:
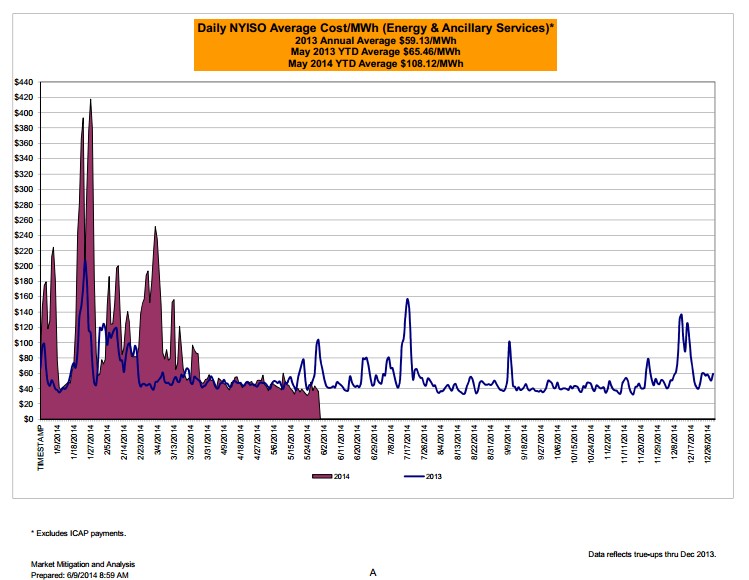
May 2014 average year-to-date monthly cost of $108.12/MWh is a 65% increase from $65.46/MWh in May 2013.
The following graphic compares year-to-date (2014) day ahead pricing to last year’s LBMP pricing through May 2013. (FYI LBMP is defined as locational based marginal pricing– simplified definition of which is “the cost to serve the next MW of Load at a specific location in the grid”).

Customers who have been floating on an index, or are on utility supply, have probably seen the market get away from them since January. It will be tough to get costs back in line with budget forecasts, particularly if you were not forecasting the spikes that we say in January, February and particularly March. Much of the impact of this pricing was attributed to the polar vortex. Extreme cold had an impact, but we say some of these spikes occur in Jan-Feb 2013 (due to natural gas pipeline constraints). In fact, there is a debate raging in New England right now about how the New England Power Pool should address these market inefficiencies and constraints.
Based on the signals the forward curves are giving us now (Jan-Feb 2015 > $120/MWh), I would not assume that what we saw this past Winter was a one-time, weather-driven anomaly.
Capacity Market Results
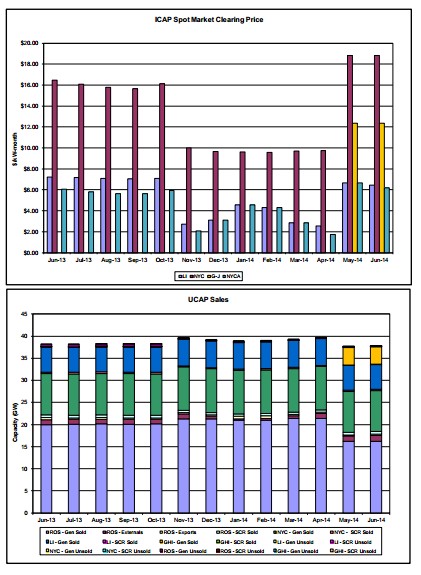
As we’ve reported here extensively, there is a new capacity zone in New York State. The capacity results for the Summer Strip auction are also in. NYC capacity costs cleared higher than a year ago as did Rest of State Capacity. We don’t have much experience in the new capacity zone (G-J)… but nevertheless the cost of capacity in the new Zone were higher than we had forecast. Take a look, below, at a graphic showing the auction clearing cost of capacity over time (last 12 months) as well as the capacity offered in the auction.
Bottomline for Businesses: Volatility is back.. in day-ahead prices, capacity markets and forward markets (more on forwards later this week). What are you doing differently now to prepare for your next budget cycle?

