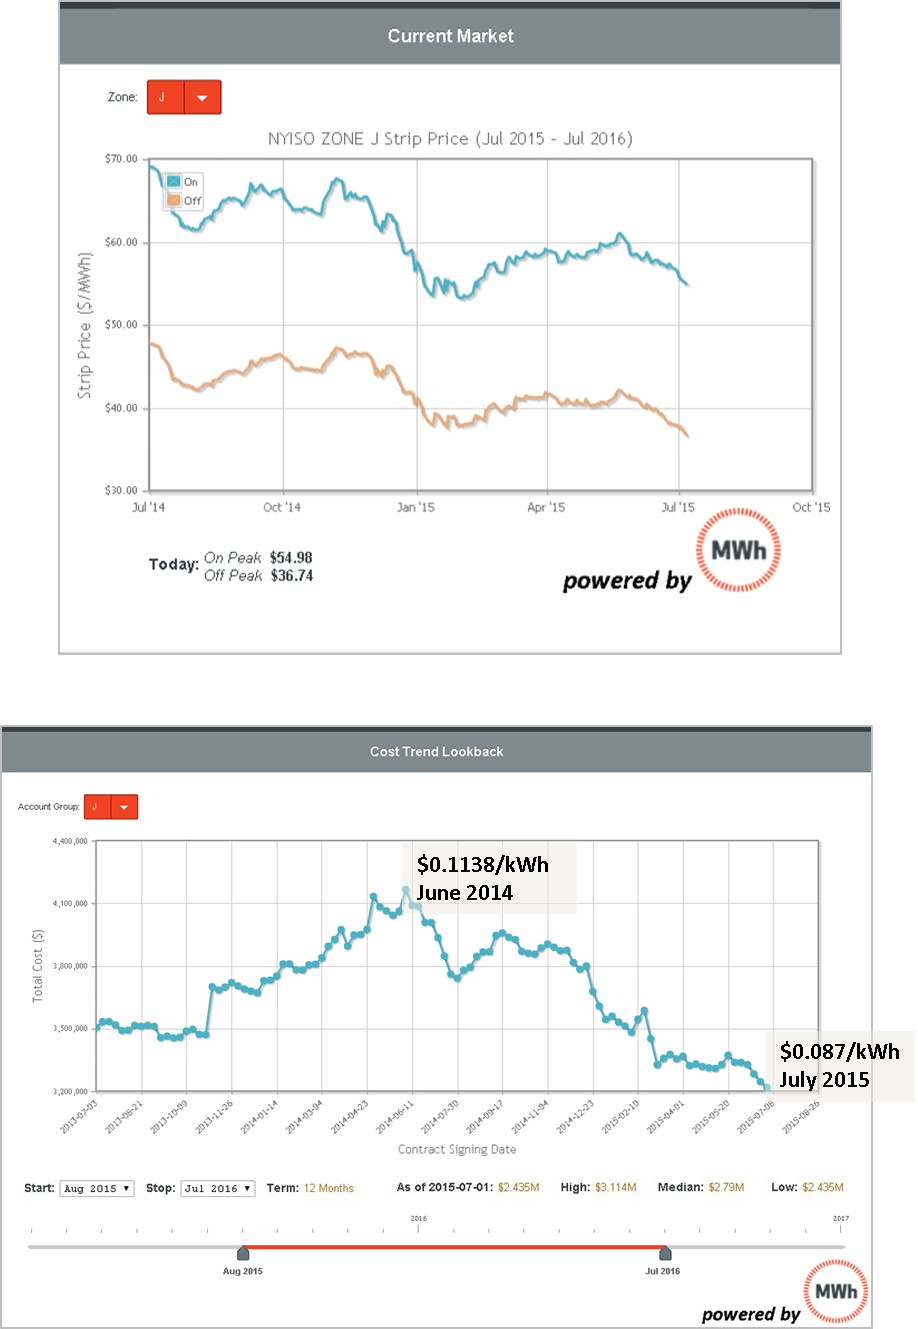
Forward markets for power have a huge impact on costs– make no mistake. Sometimes that can be good news. You can see this in a very dramatic way by looking at the following graphic.
The upper graph shows the trend in forward curves over the last year.
Market dynamics have been dramatic and volatile– that’s not all bad for customers
The lower graph tracks the total contract rate for a twelve (12) month term beginning in August of this year. You can see how costs have “moved” over the past 24 months. The difference, in unit rates, between the high period and the historical low.. which we are approaching, is nearly 3 cents. That’s 23%. For institutions on tight budgets, that’s the difference between adding new teaching positions, investing in new facility improvements, or not. As we have mentioned in another post that touches on the topic of capacity, it is important to understand how your capacity tag and its cost impacts your overall price. While the decline in market prices has had a significant impact on forward prices, capacity costs have increased for some buyers due to changes in the capacity market dynamics. We’ve posted information on recent dynamics that impact capacity costs.
Bottom line for businesses: Customer and account-specific insights about market dynamics are essential to ensuring good business outcomes when you manage your energy costs.

