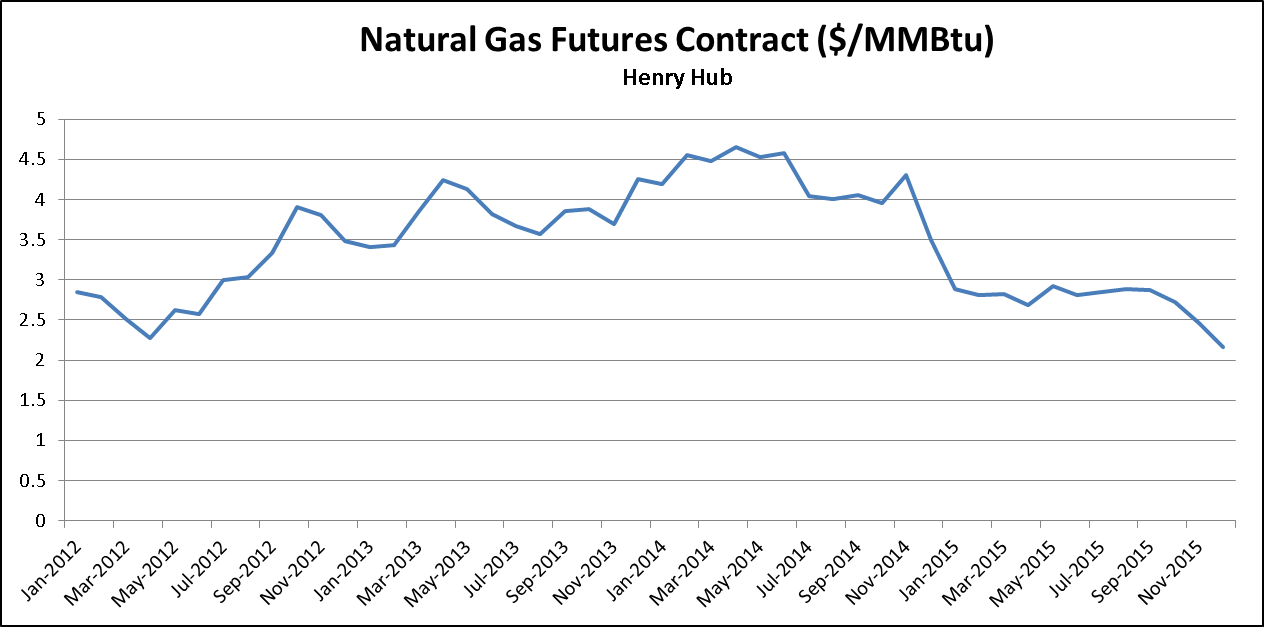
What is happening with natural gas? Where is the market compared to historical forward prices? How about historical spot prices?
Customers have been asking for some context on where gas prices are compared to historical prices. Some context is always helpful.

The last 2 months were the the 2 lowest forward price months since March 2012 (which represented another recent low in natural gas forward pricing). Nov ‘15 = $2.46/MMBtu and Dec ‘15 = $2.16/MMBtu. Early 2014 futures were the highest months for the period represented here (January 2012 through December 2015).
It is helpful to have a sense for how forward prices have moved over time, but what about spot prices? How do the forwards compare to historical spot prices?

As you would expect, we see more volatility in the spot prices. The average spot price for the period was $3.34/MMBtu. The average spot price for the prior 12 month period was $2.58/MMBtu.
Some discussion…
Bottom line for businesses: Conventional wisdom and historical data (2012) indicate that in periods of mild (winter) weather with high storage levels, prices tend to decline. This is a possible scenario for Spring-Summer 2016. Although we usually recommend that customers should take opportunities to buy as they are presented and not try to make the perfect buying decision.
