Comparison of Product Options over the past 12 months: Index vs. Fixed vs. Utility Default Rate
This is the fifth article in a series that addresses various questions raised by our clients during the course of working with us.
Clients are interested in understanding the benefits of signing a fixed, index or block and index contract. (This article will not define the products. For definitions of each product, see these articles.)
Because these different products perform differently in different market and usage environments, we had to make a few assumptions to produce some output for analysis. Here are our assumptions:
- We used generic commercial building usage data in Manhattan. Usage for commercial buildings tends to be fairly predictable and consistent year over year.
- We assume that the client signed an agreement 45 days ahead of power flowing.
- Power flowed on July 15, 2015 and ran for 12 months through June 2016.
The results were interesting. Take a look at the following graph from MWh software, which shows the fixed unit rate (in green) of $0.061/kWh compared to an index rate of $0.062 (the red line and the red bar at right) and to the Con Edison Market Supply Charge, or default rate (the orange line and orange bar at right).
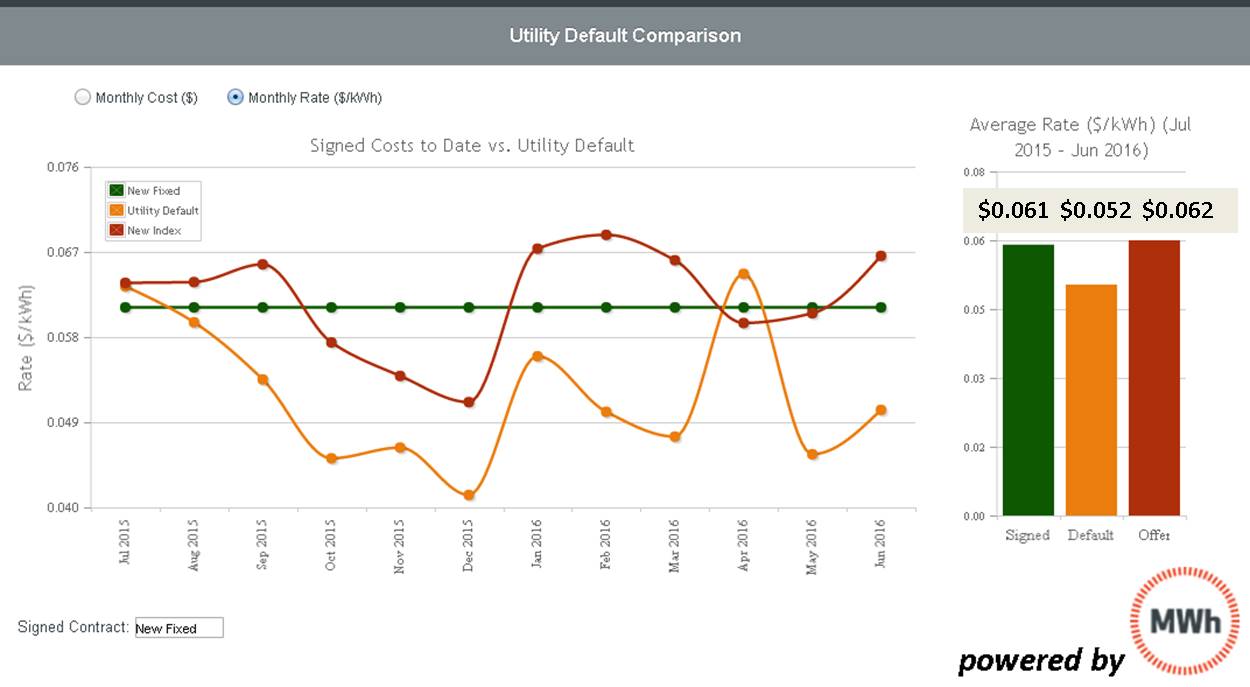
Over the last 12 months, the lowest cost option was the utility default rate. Energy managers and finance professionals should note that the costs that a customer would incur on utility default rate are highly idiosyncratic and determined by usage, capacity costs, and peak demand. It is unusual to see a default rate come in as low as this building’s rate did and this particular analysis shouldn’t be viewed as a predictor for all buildings. You will also notice that the utility default rate, like the index rate, varied from month-to-month, from $0.065/kWh in April and July, down to $0.041/kWh in December.
When comparing the fixed to index rate over the past year, the fixed price came in slightly lower than the index rate. This is an unexpected result. Since energy buyers who sign fixed price contracts are in effect asking suppliers to take risk on their behalf (market risk, usage risk), you would usually expect to see an index rate come in lower than a fixed contract. After all, suppliers have a right to charge more for the product that gives them more risk (often referred to as a “risk premium”). It’s not generally to be expected that a buyer can get a lower risk product that is also lower cost.
Here are some thoughts to consider:
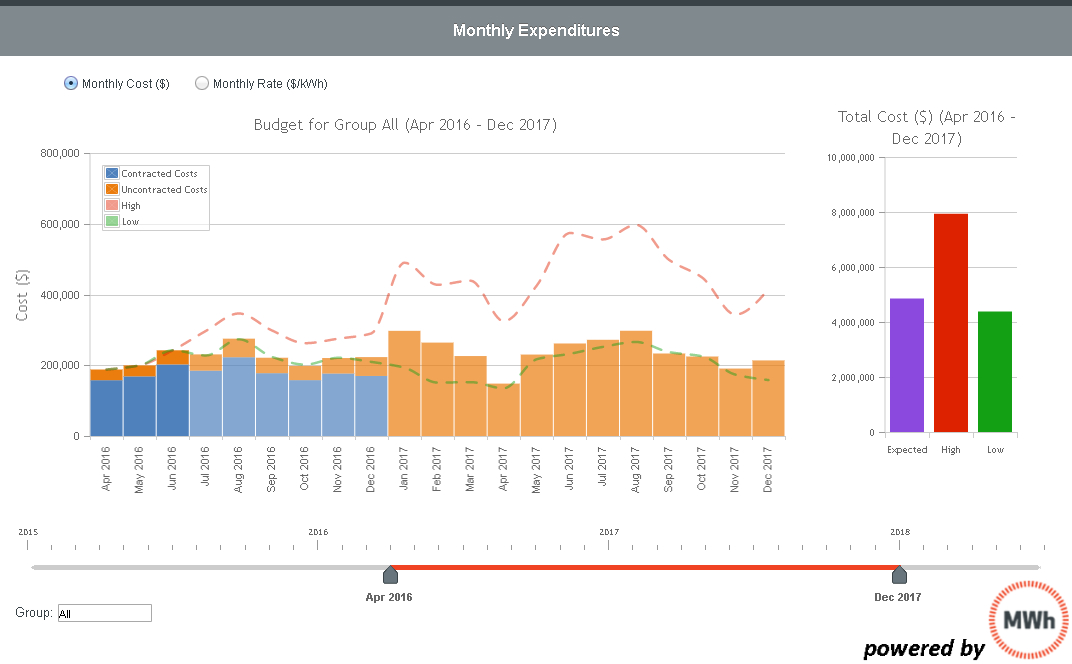
Both forward markets and index markets have recently been historically low and have not displayed any meaningful volatility. The past 12 months are not representative of what you might expect in most years. As you can see from the following graph, we compare current forecast pricing to historical highs and lows. You can see that the forward pricing for this past year is near historic lows. The dotted green line, which depicts historically low costs, track closely to the orange bars, which are the forecasted monthly costs for this hypothetical client.
Note that your objectives as a buyer are critical to determining the right product for you in any given market environment. Specifically, do you care about having an ability to budget and forecast your costs and usage? Can your budget withstand higher-than-anticipated costs? Can your cash management easily deal with unpredictable cost swings? You should consider these issues carefully; do not simply review historical and forecast pricing and pick the option that you believe (or hope) is going to be lowest.
Bottom line for energy buyers: It is important to determine your organization’s objectives and risk tolerance before you select an energy product. It is also important to have a forward-looking view of usage and cost in order to properly evaluate all options. Finally, it is always good to have flexibility built into your purchasing strategy so that you, as a buyer, can respond to market changes.