Energy prices determine as much as 40-60% of the price you pay for electricity. No matter whether your business strategy is to fix all of your costs or maintain some exposure to index prices (day-ahead, usually), knowing historical and forecasted pricing should be important to you. The only way to forecast index pricing is to use the forward curve as a proxy. Index prices clear hourly on a day-ahead or real-time basis, so there is no “forward curve” for index prices. That’s what makes them an “index”.
In any case, it is nearly impossible to get a transparent view of forward prices. And it can be time consuming to understand the dynamics of index prices. So in order to support energy manager and financial decision making around energy, we provide periodic updates on markets and pricing.
Day ahead energy prices
As we’ve reported here a number of times, day ahead energy markets in the Northeast have been low over the past several years. This trend continues through June 2017, although markets are up modestly compared to a year ago.
As quoted from the NYISO’s June 2017 Market Performance report:
Market Performance Highlights June 2017
• LBMP for June is $31.76/MWh; higher than $31.74/MWh in May 2017 and $27.35/MWh in
June 2016.– Day Ahead Load Weighted LBMPs are higher and Real Time Load Weighted LBMPs are higher
compared to May.• June 2017 average year-to-date monthly cost of $36.01/MWh is a 20% increase from
$29.93/MWh in June 2016.
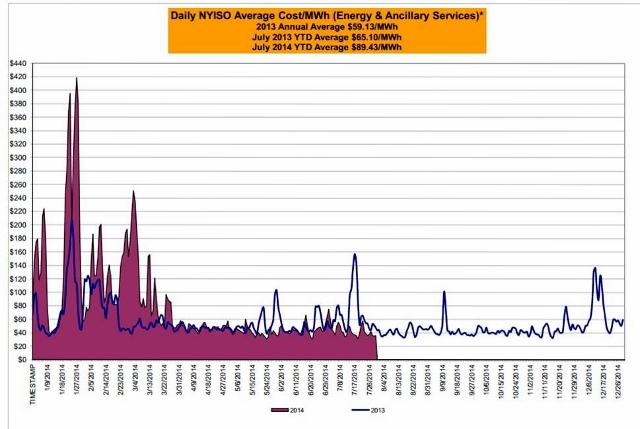
The following graph shows how day ahead (LBMP) pricing year-to-date through June 2017 compares to 2016. Note that we are in a period of relatively low index costs.
")
Even comparing the graph from last month’s ISO report to the same report from July 2014 gives a great indication of how comparatively calm markets have been lately. Here is the same graph from the ISO’s July 2014 report:
Forward prices for energy
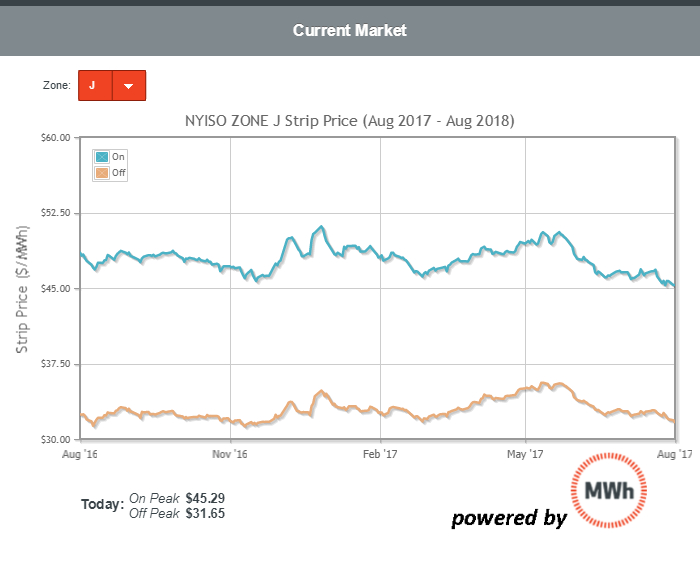
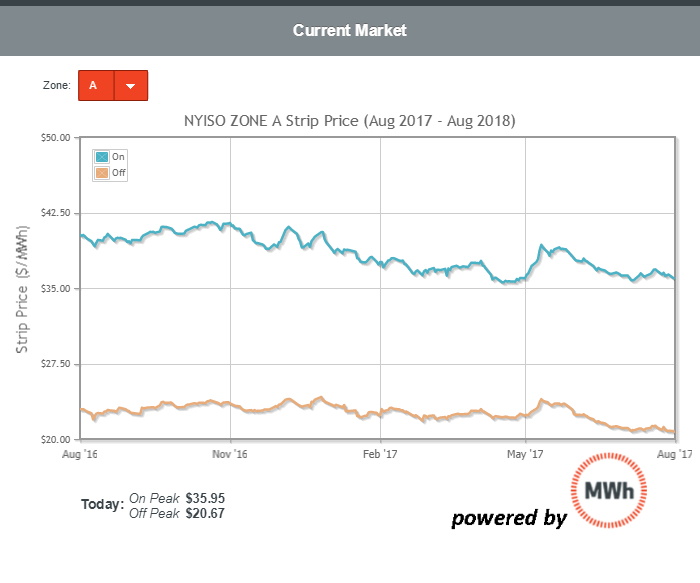
Like index prices, forward markets for power are low and also lack any significant volatility. The next two graphs show the forward on and off peak energy price in Zone J (New York City) and Zone A (Western NY). These graphs show you how the same price strip of on and off peak power has changed over the last 12 months. So you can see how the price of power for the same 12 month time frame (August 2017-August 2018) has moved since a year ago.
NYC Forward Energy Prices: Aug ’17- Aug ’18
Western NY Forward Energy Prices: Aug ’17- Aug ’18
Like index prices, forward markets have seen relatively low volatility, particularly in recent months. We recommend keeping an eye on markets and pricing on a regular basis. Low volatility can lull purchasers into a sense of certitude about the levels and direction of pricing. Without a continuous forecasting, review and monitoring process in place, energy managers, financial decision makers and purchasing departments can be caught off guard when normal volatility returns.
Bottom line for businesses: Day ahead and forward prices, while periodically volatile, are relatively low. Put all historical and forecast costs in context when evaluating purchasing strategies.