We aren’t very good at highlighting our successes. We are usually satisfied when a customer is happy and has achieved their goals. But every now and then a customer’s results are so striking that we feel we have to share their story.
Background
But first, before we tell their story, a few key points.
- Chasing elusive savings. In general, we don’t promise our clients they’ll achieve “savings” with The Megawatt Hour. We operate in dynamic commodity markets, and even creating a meaningful benchmark against which “savings” would be defined can be difficult. To us, it is far more important to identify business objectives, manage risk and track outcomes than it is to try to save money compared to an energy benchmark that changes hour-to-hour.
- But.. . . the problem with being principled about NOT focusing on savings is that customers understandably care about savings. Customers want to look in the rear view mirror and compare what they paid for power or gas delivery and supply and they want to compare what they paid to:
- What they paid last year
- What they would have paid their utility if they’d “done nothing”
- Customers are wise to request this information. Why? Not because they should be focused on what happened compared to a moving benchmark, but because it can, and should, inform the next decision that they make. It doesn’t mean that they’ve failed or not done their job if they aren’t able to show savings, but having that information can prove helpful in updating or revising future decisions in an organization. And it is how customers are evaluated by their stakeholders. Ignoring those metrics does not help customers.
- So…like it or not, we need to answer these questions for customers. This kind of tracking (“what did we pay compared to…..”) can be difficult to find. It is often impossible for customers to figure out (no time and no tools) and it can be difficult and time-consuming for consultants and brokers.
- MWh software tracks costs compared to a utility tariff and/or to other options automatically. It is a quick way to see how a contract is performing. Customers want it, so we show it to them.
What are we celebrating?
A MWh client located near Manhattan used MWh software to make a future purchasing decision part way through their existing contract term. They decided that the price they found thanks to MWh software was low enough compared to their budget expectation that it made sense to make a purchase in April 2016 for a contract that wouldn’t begin until August 2016.
What information did they use to make this decision?
- MWh’s pricing model, which gives customers a forecast of what, in this case, their retail electricity price should be for the product and contract term in question. The pricing model uses the customer’s usage profile and market information to show the customer exactly what price they should be getting from suppliers. It’s like using Kayak to get a peek at what airfare costs from Dallas to Chicago.
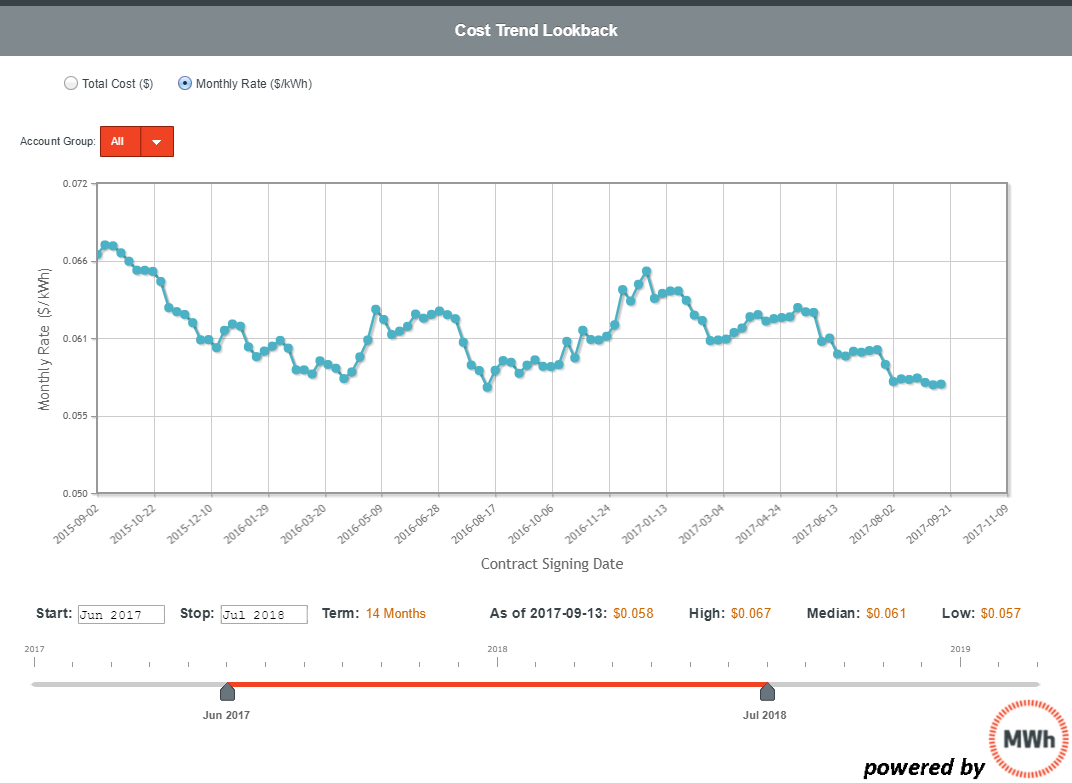
- MWh’s cost trend graph shows the customer how the price that they’re seeing in the market today for a set term compares to historical pricing. That information gives customers confidence that they are buying during the right trend. And that they are probably not leaving a lot of value on the table. You can see an example of the cost trend look back, below. You can see how the unit rate for the same contract term (June 2017-July 2018) has changed over time. The trend in this graph is headed in the right direction for a customer interested in making a purchase, and current prices are as low or lower than the recent prices.

What happened?
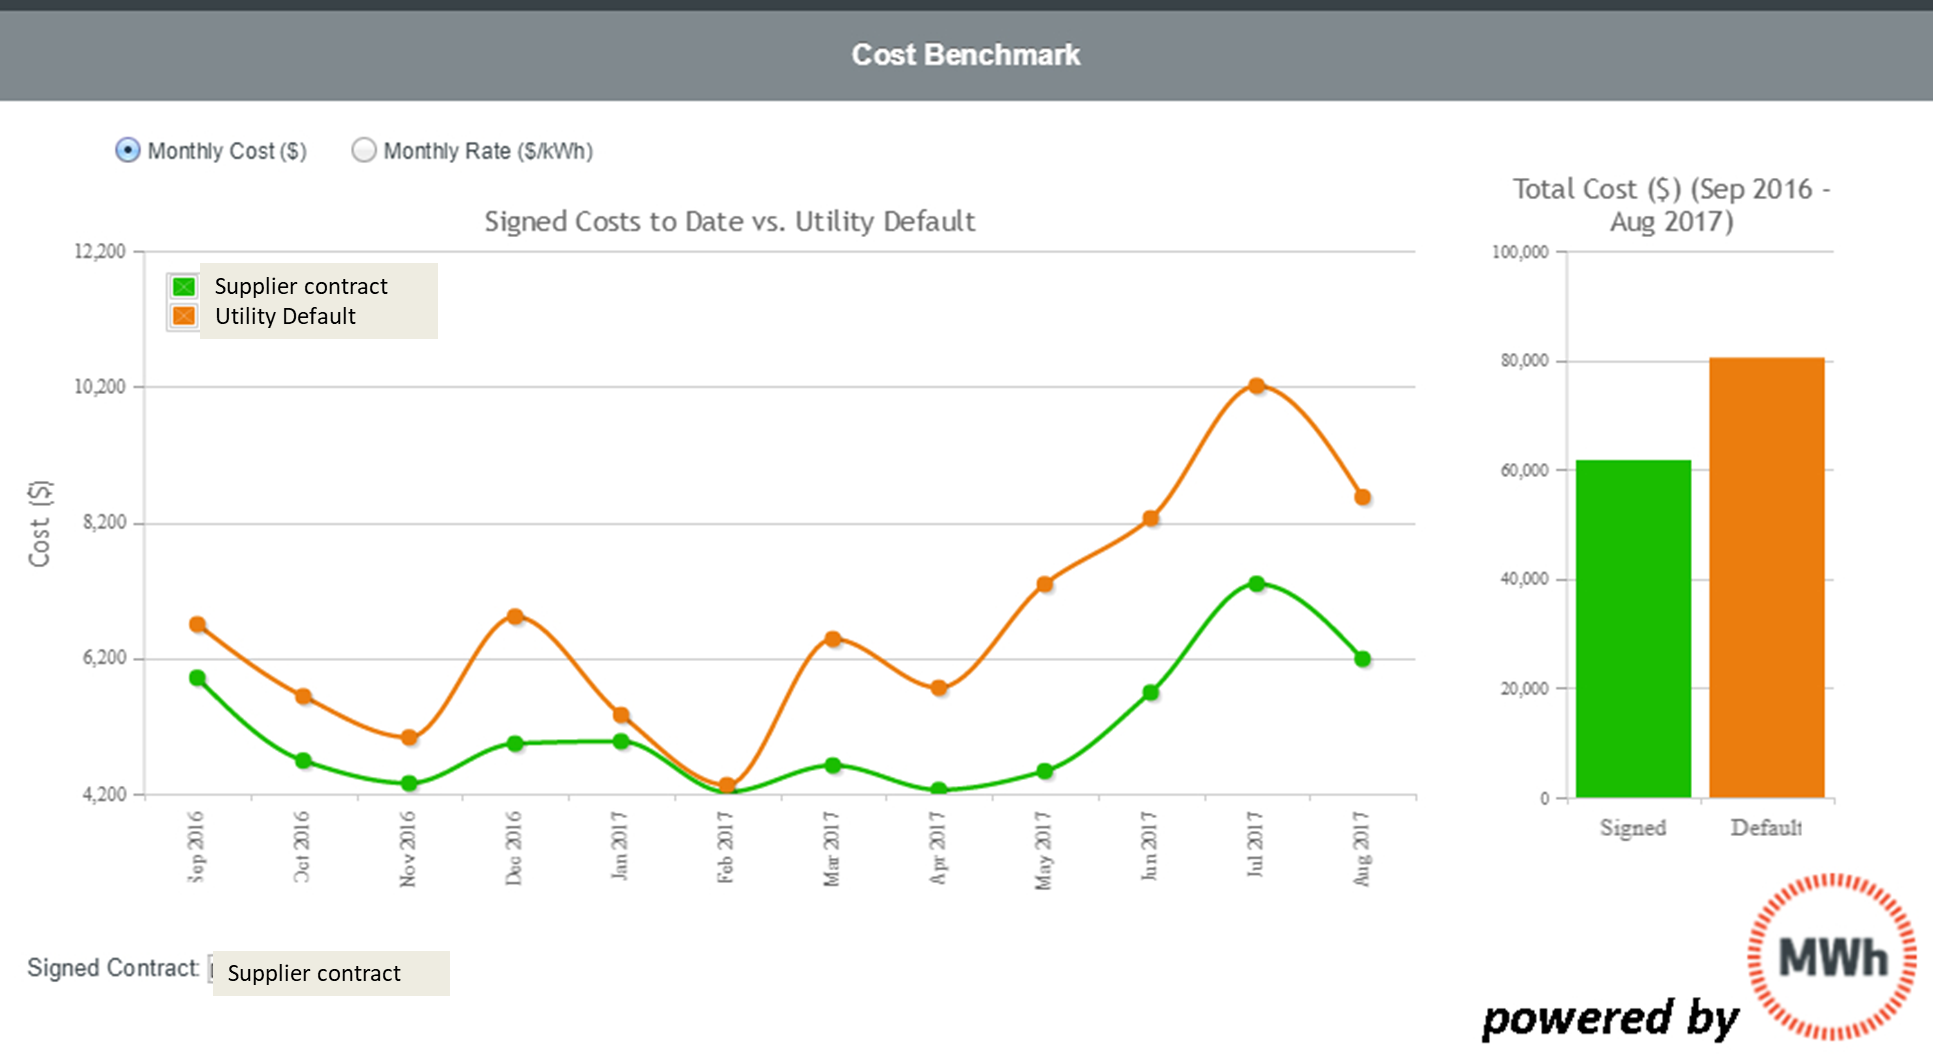
The decision process and resulting customer transaction we described above had the following results, as shown in the chart below: the orange line shows what the customer would have paid the utility if they had done nothing. The green line shows the monthly customer costs for electricity supply based on the contract they signed with the help of The Megawatt Hour.
This customer would have paid 25% more if they had stayed with utility supply. These results are outstanding.

Bottom line for finance professionals and energy managers: With the right tools and the right strategy, customers can get great results from actively managing gas and power supply. It should be the first and simplest step to getting control over your energy costs. 25% cost savings to a higher ed client can = a salary or to a health care client it = a nurse’s salary. Oh, and while you’re at it, don’t forget to celebrate your victories.
