It is newsworthy that gas and power markets were up over 7% last week. This increase in forward curves follows months of low cost power and gas markets. As of Friday afternoon, there was some relief thanks to a modest price decline for the Winter 2018 months.
To put this in context, we have been at historic lows for power and gas for over 12 months. So it is important to convey that there is no need to panic. Markets remain relatively low.
What happened?
Basically, the Northeast (and much of the rest of the country) finally experienced normal November weather. With the colder weather, came some bullish natural gas movements and trader activity that drove prices higher.
Seeking Alpha’s Weekly Natural Gas Recap included the following details:
- Natural gas prices finished the week higher by 7.67%.
- Natural gas broke through a period of rangebound price action.
- Fundamentals via our storage estimates are still bullish, but weather can throw a kink to the bull’s parade.
Rangebound price action means that prices don’t move dramatically up or down. They go through a period of consolidation and move sideways instead of breaking out of a narrowly defined range.
In the prior week, Seeking Alpha talked about how low natural gas contracts were– and how susceptible to weather the pricing can be.
So, from a fundamental analysis point of view, we stand by our analysis that 2017-2018 winter contracts remain unbelievably cheap relative to the potential outcomes present. The set-up is not as promising as it was back in November 2016 when the structural deficit was on the rise (vs. on the decrease today), but the upside is still present especially when the weather models flip-flop like they always do.
Last week, the weather set in and the market moved up. Note that from Seeking Alpha’s point-of-view a “promising” set-up would indicate conditions that would send prices higher. Most customers are happy to see low prices that are not volatile. As such, these market movements as tracked by organizations like Seeking Alpha are a boon to wholesale traders and contract holders, not to you the buyer. Whenever we discuss market movements and their impacts, we have to translate the market enthusiasm properly for our customers. You are on the wrong side of the trader’s profit and loss. You want the market to go low and stay low.
How do we track price movements?
Below, you’ll see a graph showing how the forward curve for the period November 2017 – November 2018 has moved over time.
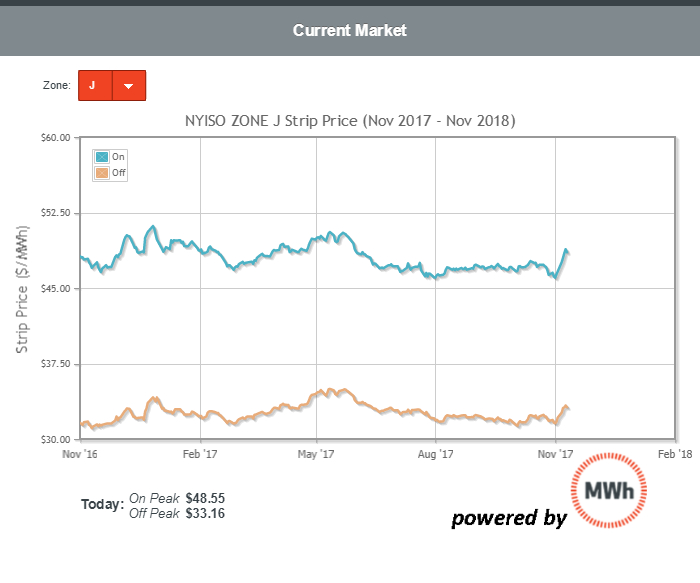
This graph appears on MWh’s dashboard. The horizontal axis represents time from (in this case) November 2017 – November 2018. The vertical axis represents wholesale on and off peak power costs in $/MWh. This graph represents the way that a 12 month “strip” of wholesale power has changed between last November and this November. So each spot on the curve represents the wholesale on peak (blue) or off peak (orange) average cost of energy for the next 12 months. On this graph, you can think of the “curve” part of the forward curve as the lines you see here connecting a series of fixed (i.e. known, established, agreed-upon) prices for exchange (purchase or sale) of power for Nov ’17 through Nov ’18. The graph is essentially a curve of the curve– showing how those forward prices have changed and moved over time. These lines represent a schedule of fixed prices that you can rely on for future purchases or sales of the asset – hence “forward.”
How should you interpret this news?
It is always beneficial to stay on top of current market information, and it always makes sense to track market movements. Buyers, however, should be careful not to give in to the temptation to focus too much short-term market movements.
Those of you who have a significant portion of your energy needs contracted in longer-term contracts with some fixed components will be insulated from this price volatility. Some of you who haven’t fixed all your costs have benefited from years of low prices and little volatility. The most important insight to keep in mind, as an end-user of energy, is that your organization is in the market for the very long term. You will participate in markets when they are high and when they are low. Over long time horizons, these peaks and troughs will average out. Your best option is to focus on planning for longer time horizons and with a specific strategy in mind.
When should I worry?
Never. But you should plan for and execute decisions if you have any significant gas or power price exposure this Winter.
Bottom line for energy buyers and financial experts: Try not to get caught up in market movements and hype. Plan your strategy based on unbiased data and information and then stick to that plan. If you have some near-term exposure to gas or power prices, you should consider your options and the full range of your exposure (are you at risk of missing your budget forecast if the market increases by another 7%? or are you relatively un-exposed?) before making any purchases.
[maxbutton id=”6″ ]