Building owners and energy managers often ask us about the cost-benefit of energy information and quality energy analytics. We have our own client experience from which to draw. Also, we have summarized information from the U.S. Department of Energy (DOE). In addition, we have reviewed information from a study conducted by global architecture and engineering firm HOK. This summary is meant to provide guidance on the value of energy analysis and analytics.
We are not here to promote any specific program. Our interest today is in explaining how to think about the cost-benefit of energy information. We provide you with information on how others have evaluated energy information and energy management systems. Our own client experiences also inform our review.
Our experience, as well as that of the DOE and HOK, indicate a very fast (from a few months to less than a year) payback on energy data and analytics.
US DOE’s Smart Energy Analytics Campaign
In recognition of the technology advances in data acquisition, modeling and energy analytics, the US DOE formed a public-private partnership, The Smart Energy Analytics Campaign. The program is meant to help building owners quantify the cost-benefit of commercially available Energy Management and Information Systems (EMIS). For information on how the program works, take a look at the Smart Energy Analytics Campaign website.
As we mentioned above, we are not here to promote any specific program. Our interest today is in explaining how to think about the cost-benefit of energy information by providing you with information on how others have evaluated energy information and energy management systems.

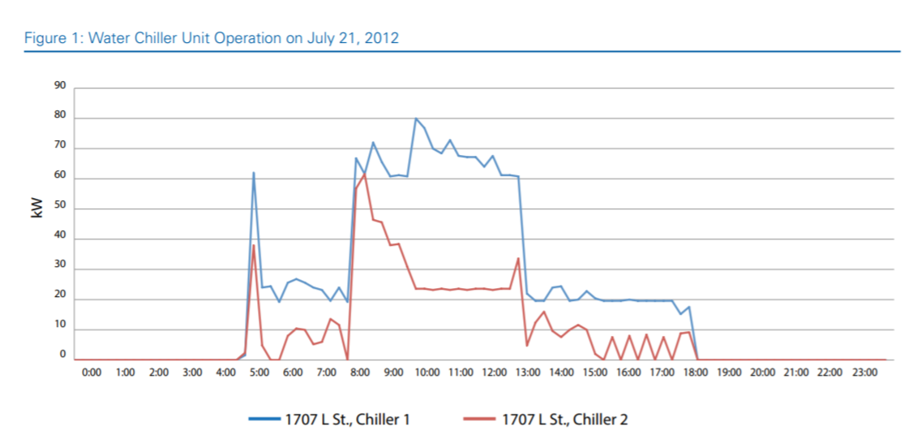
A Case Study of Three Large Commercial
Buildings in Washington, D.C.”)
Program impacts
After the program’s first year, the Campaign measured the impact of EMIS investments based on data provided by program participants. The executive summary of the year one report (published in the Fall of 2017) describes the benefits as follows:
With the first year of the Smart Energy Analytics Campaign complete, this report summarizes EMIS implementation by Campaign participants, totaling 185 million sq ft of floor area. The report also characterizes EMIS products, MBCx services, and trends in delivery to industry. This information will be updated each year based on continued data collection over the course of the Smart Energy Analytics Campaign.
Campaign participants have made improvements to their buildings, achieving a median energy savings of 5 percent for 400 billion Btu/year and $9M/year, based on 15 participants reporting…. preliminary savings and costs lead to highly promising cost-effectiveness figures, with less than a 1-year simple payback (emphasis added).
The Program reports that implementing EMIS software is a cost-effective way to gain insight about building operations and to identify cost-saving opportunities. The program report suggests that:
The high level of participation in the Smart Energy Analytics Campaign points to a growing national trend in the use of analytics in commercial buildings. The Campaign supports an expansion in the use and acceptance of EMIS, helping organizations move beyond data paralysis to building operations that are continuously informed and improved using analytics.
The Shockingly Short Payback of Energy Modeling
In 2016, Anica Landreneau, director of sustainability consulting at global architecture and engineering firm HOK, set out to determine the typical payback of energy modeling. She did so by surveying and tracking client implementations. A summary of the report titled “The Shockingly Short Payback of Energy Modeling’ is published on the US DOE’s Office of Energy Efficiency and Renewable Energy website. The summary explains the methodology in the following way:
Over the course of several years, HOK tracked both modeling costs and predicted energy savings for a large number of HOK projects. The answer—energy modeling payback is typically 1 or 2 months!—is surprising at first. But it shouldn’t be. For large buildings, modeling costs run from $30,000 to $200,000 depending on the ECMs considered and the tools required to evaluate them. Even the high side of that figure is a fraction of the annual energy costs of a typical large building. If modeling can help designers quantify the energy savings of ECMs and get them accepted into the design it can pay for itself very quickly.
What do these analyses tell us?
These two analyses raise critical issues that we, also, find in the work that we do for clients:
- Without good data and analytics, it is difficult to establish a baseline by which to make a range of decisions. Whether you are implementing energy conservation and efficiency measures or determining the best strategy for managing energy costs, information is essential. As Landreneau mentions in her research, we don’t buy cars without gaining an understanding of how the automobile’s MPG rating compares to other cars in its class. Why not get comparable ratings for energy costs are your facilities?
- In addition, these analysis highlight another critical issue that we find in our work also. Access to data and analytics allows continuous improvement in managing energy costs and usage. Energy and financial decision makers are consistently asked to improve results at their facilities, and to continuously lower cost and usage at their facilities. Software is essential to delivering on those results-and it is not only essential, it is a prerequisite for lowering cost and usage in the future.
MWh Client Experience & Results
MWh customers typically save 10 to 15% per year in avoided time managing energy and lower direct energy costs. The software typically identifies obvious errors, or clear opportunities for lowering costs. Thus, there are often measures that customers consider “low hanging fruit”.

Customers gain returns in 4 significant ways:
- Lowers time required to manage energy. More efficient data management, reporting and updating reduces the time required to manage utility information. Clients report reducing time spent on this area from 5-6 days per month to less than a day per month.
- Greater transparency results in avoided costs. MWh cost management process identifies purchasing and cost-reduction opportunities. The timing of purchases can result in savings and/or cost avoidance of 15-20+%. Recently, the MWh system was able to lower costs for a client by $0.02/kWh. Here’s another article that highlights the value of transparency gained from MWh service.
- Less time managing data means more time catching errors. MWh cost benchmarking identifies major contract inefficiencies and/or billing and invoicing errors. Rrecent client experience identified invoice discrepancies of 40% as well as sales tax over-charges = 20%.
- Validating decision making and improving analytics. MWh software automatically documented the energy and cost savings resulting from a recent boiler replacement for one client. Another client validated the savings from active capacity management. That client saved over $300,000 in one year by reducing their capacity costs. It is instructive to have information on the benefit of energy interventions in retrospect. It is even more powerful to identify the cost-benefit of interventions on future cost and usage.
Bottom line for finance and energy professionals
Energy data and analytics can deliver significant value to commercial and industrial customers and building owners. Building owners and commercial/industrial customers should employ information and software in order to identify cost-effective ways to lower usage and reduce cost. In addition to often identifying obvious opportunities for lowering costs, software can also present opportunities for ongoing and continuous improvements.
