Clients have been asking us what has been happening with natural gas prices (they are low and seem to be falling daily)? You can see historical gas prices here.
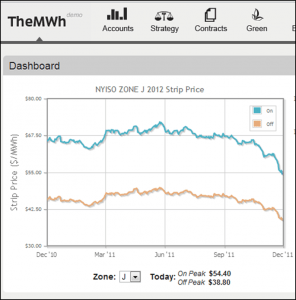
If you look at The Megawatt Hour forward curve on our dashboard, you’ll see a remarkable graphic. This is the forward curve for electricity for the calendar year 2012.
As a NYISO report on fuel diversity explains:
Most new power plant capacity added in the U.S. in the past decade relies on natural gas
to generate electricity…..While the overall percentage of power generated by natural gas increased only
modestly nationwide, natural gas price[s] have a disproportionate effect on
wholesale electricity prices in certain power markets in the U.S, including in New York (Fuel Diversity in the New York Electricity Market: A New York ISO White Paper October 2008).
So that’s why natural gas prices are so relevant to buyers of power in New York State.
We have always been reluctant to make predictions about where markets will go. That isn’t our business– and there are plenty of other professionals who are better positioned to opine on markets and how and where they’re likely to go. If we were in that business, and we’d made the right moves, we’d be here….
Nevertheless, we thought it appropriate to gather information from various sources who we believe are reputable, and try to shed some light on the issue. We have included links and references wherever we can.
What is influencing gas prices?
Needless to say, it is a matter of supply and demand. I know this is all obvious, but these are some of the factors that impact supply and demand, according to the experts.
New domestic resources– shale gas
The impact of shale gas on markets is significant. Note this summary from the US Energy Information Administration:
In the Northeastern United States, natural gas production has grown rapidly since early 2009 as a result of increased drilling activity in the Marcellus Shale. The largest production gains have occurred in Northeastern Pennsylvania, with noticeable increases also in Southwestern Pennsylvania and West Virginia. According to Bentek Energy, LLC estimates, natural gas production in West Virginia and Pennsylvania now averages almost 4 billion cubic feet per day (Bcf/d), more than five times as much as the average from 2004 through 2008. It accounts for over 85% of total Northeastern natural gas production.
The chart below highlights these trends:
- Production in Northeastern Pennsylvania recently passed 2 Bcf/d, up from just 0.4 Bcf/d at the start of 2010.
- In Southwestern Pennsylvania, production is over 0.8 Bcf/d, more than three times the level at the beginning of 2010.
- In West Virginia, production has grown over 40% since January 2010 and recently surpassed 1 Bcf/d.
- Production in the rest of the Northeast has been roughly unchanged since 2007.
There looks to be more shale gas where that came from– although needless to say extraction of shale gas is not without risk and controversy.
These numbers help explain why it is that natural gas prices have fallen from a high of $13.31/mmBtu in July, 2008, to a recent record low of $2.83/mmBtu (spot price) in the end of November.
Reduced demand, for now…
US and global recession have depressed demand for commodities in general. Natural gas is no exception, although some experts believe this may change.
Recent EPA rulings regulating emissions from coal-fired power plants coupled with recent moves in the residential sector to switch to natural gas as a heating fuel (from fuel oil, particularly in the Northeast) may put some upward pressure on demand in the next 12-24 months. The following Figures show natural gas consumption by sector, and the trend away from oil as a heating source– in favor of natural gas heating. And note that the industrial sector demand for natural gas has increased 5 percent per year since 2009 (Spark, Public Utilities Fortnightly “Cheap Gas Forever? Demand Curve Points to Rising Prices”, September 28, 2011).
How long will this last?
Of course, this is the big question. A recent article from Public Utilities Fortnightly’s Spark publication suggests that “the supply of natural gas is not elastic enough to handle the price impact of significant demand increases” (Spark, Public Utilities Fortnightly “Cheap Gas Forever? Demand Curve Points to Rising Prices”, September 28, 2011). These comments also suggest that price increases are inevitable– and the only question, as the article states, is how high and how fast prices increase.
If we use historical prices as a guide, the message buyers get is that there is much more downside (price increase) risk, then upside opportunity. But then again, you never know.
While it perhaps doesn’t shed as much light on this discussion as other information resources, we found this conversation (available on the Platts video site) interesting– it discusses the reason for divergent global prices for natural gas. Follow this link to view the video.
What do you think? We’d love to hear your thoughts.


