An understanding of the status of NY Energy Markets (both energy and capacity) is essential to managing energy costs. Both short term and longer-term power prices impact customers, as do capacity markets. Why focus on power and capacity? Electricity supply is comprised of a range of components. Two specific components, power and capacity, comprise 70% of your costs. Understanding the market dynamics of both components will enable you to plan more effectively. Furthermore, capacity costs have increased in the past year to such an extent that capacity costs, particularly in NY City, will increase your overall electricity supply rate.
Energy markets: Capacity and power market dynamics
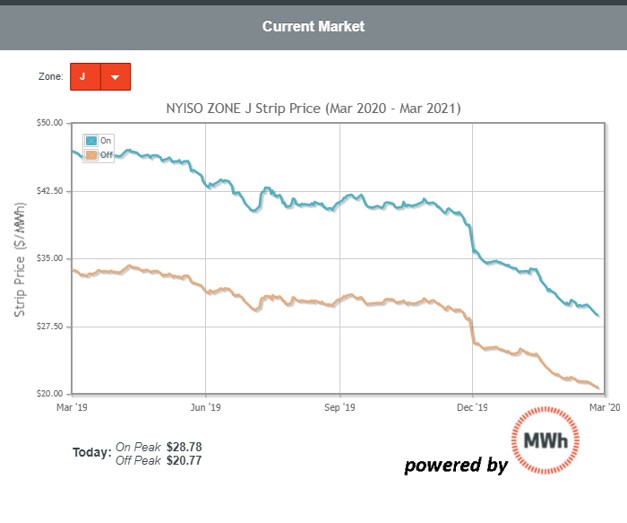
Forward power markets in NY and the Northeast have reach new lows. Day-ahead index prices are also at historic lows.
Why should customers care about this forward market reduction?
Customers who are looking to plan or who are inclined to remove some exposure to future power prices should consider taking advantage of this market movement. Customers who care most about ensuring they have budget certainty should consider purchasing some component of their electricity supply. The NY City market has seen prices well in excess of $50/MWh in the past. Market prices below $29/MWh represent an important buying opportunity. Note that forward prices are now below the historic low index prices that we’ve seen over the last year. This shift is another good reason to look at hedging some component of power if you have any desire to manage energy budgets.
Index Prices
For customers who have some exposure to (day ahead) index prices, these markets have also been low and relatively lacking volatility. The following picture shows 2019 index prices (in blue) compared to 2018 index prices (in purple).
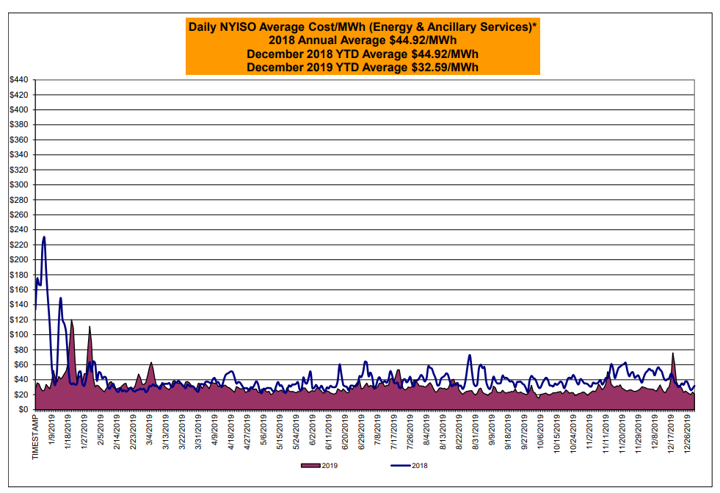
Day ahead markets across the state declined through December 2019 (purple graph- YTD average $32.59/MWh) compared to all of 2018 (blue line 2018 $44.92/MWh). Keep in mind that this is the average of energy and ancillaries from Long Island to the farthest reaches of Upstate New York.
Customers who have either index exposure or who have chosen to remain with their utility for supply in NY will have paid the day ahead index price. Index prices have been low during this calendar year. However, customers who choose to receive index energy will not be able to ensure budget certainty in the future. For example, index prices in January 2018 were high and volatile. In January 2018, index energy customers would have paid as much as $220/MWh and their budgets could been significantly impacted by these power rates.
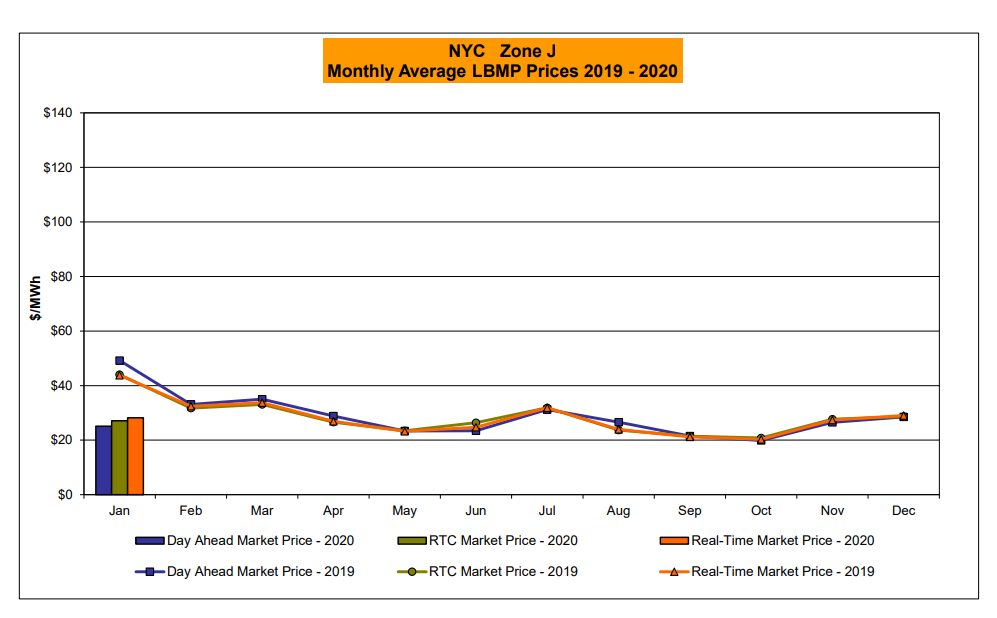
This year, 2020, has also started with little to no volatility and very low index prices. We use Zone J (NYC) as an example here. Note that the day ahead market prices for January 2020 were almost $25/MWh lower than the 2018 index price.
What is the impact of these dynamics on you, the energy buyer?
The implications of a low forward market and a low index market will differ for customers based on their purchasing strategy. For fixed rate buyers, you will find that your benchmark rate (based on an index in NY) is probably lower than your contract rate. That’s all right– you didn’t purchase a fixed rate contract in order to “save money”, you opted for budget certainty. You may want to consider a renewal agreement for your next contract term given where prices are today. The forward power curve for the next 24 months is low. However, 2023 and 2024 indicate otherwise (due to commitments to transition to more renewable energy in those years).
Block and index buyers will note a decline in your weighted average cost of electricity. Your cost of index power will lower your overall cost when averaged in with your fixed rate. And, finally, for index only strategies, your power costs will continue to be low and lacking volatility.
Capacity prices
Depending on your location, up to 20% of your costs are determined by the cost of capacity. Utilities assign each electric account a capacity obligation (based on a NYISO-determined calculation). In turn, each electricity supplier (no matter whether you take electricity supply from your utility or from a retail supplier) must purchase installed capacity to meet that obligation. The market price is set by annual and/or monthly auction processes that differ among the ISOs. This cost will be the second largest component of your electricity cost. (There is no installed capacity obligation or cost in ERCOT.) For more definitions and helpful resources, see TheMWh’s Resources page.
Capacity costs have also been low across the State of NY for several years. In the Fall of 2018, however, NYC summer capacity prices in the forward market increased from $8/kW month to $14/kW month. Capacity costs almost doubled. These increases were clearly evident in pricing to customers.
See the graph below, published by the NY Independent System Operator (ISO), for a record of spot market clearing prices from February 2019 through February 2020 across the state. Note that NYC market clearing prices have increased over the past few months while capacity costs elsewhere have declined.

Bottom line for customers: Insight into the actual forward and index cost of power and costs of capacity is the only way to properly manage energy exposure. Plan ahead. Don’t be lulled into complacency when markets are low and not volatile. There is no guarantee that markets will continue to be low and easy to manage and navigate. Keep an eye on costs over the next one to three years.